Concept of ‘estimation with confidence’ is normally used by everybody in their daily lives. For example, a person may say ‘I believe there are 90 percent chances that Congress will win in the next elections with more than 350 seats’. Here, the person’s confidence level is 90 percent and he is estimating by how much seats congress will win. Let’s move forward to the formal concept of ‘estimation with confidence’.
There are two types of tests one-tailed and two-tailed, we will discuss ‘estimation with confidence’ in each of the case separately.
Estimating with Confidence in a One Tailed Test
In the single tailed test we estimate with the given level of confidence whether the estimated value is same as the population value or either statistically greater than or less than the population value/expected value (for simplicity we are assuming normal distribution). In this we can have right or left tailed test.
Left Tailed : Let us assume the given level of confidence is 85%, from Fig-I we see yellow area is the rejection region. So, with 85% confidence we can say that our estimated value won’t b statistically smaller from the population value/expected value and there is only 15 % probability that it will be statistically smaller.
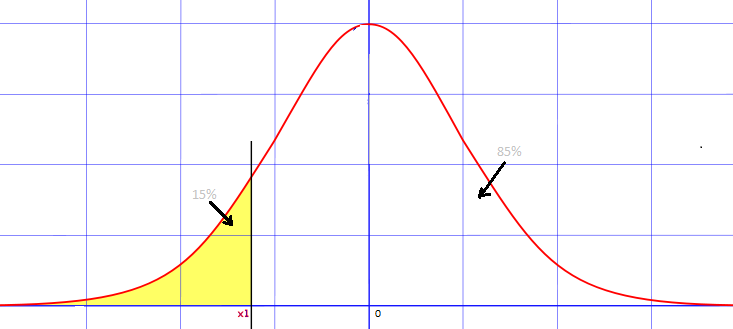
FIG-I
Right Tailed: In this case the calculation remains the same, the only difference we don’t want statistically greater value than population value/expected value rather than less than as in the previous case. We represent right tailed estimation as in Fig-II. Here yellow shaded region is the rejection area. Confidence level is 85%. So, with 85% confidence we can say that our estimated value won’t b statistically greater from the population value/expected value and there is only 15 % probability that it will be statistically greater.

FIG-II
Estimating with Confidence in Two Tailed Test
Under a two tailed estimation with confidence we do not want either too big or too small value in comparison to the population value/expected value. In other words, we have rejection area on the both tails of the curve (as shown in Fig-III). Here, the yellow shaded area is the rejection area. Here, the confidence level is of 70%. So, with 70% confidence we can say that our estimated value won’t b statistically different from the population value/expected value and there is only 30% probability that it will be statistically different.

FIG-III
No comments:
Post a Comment